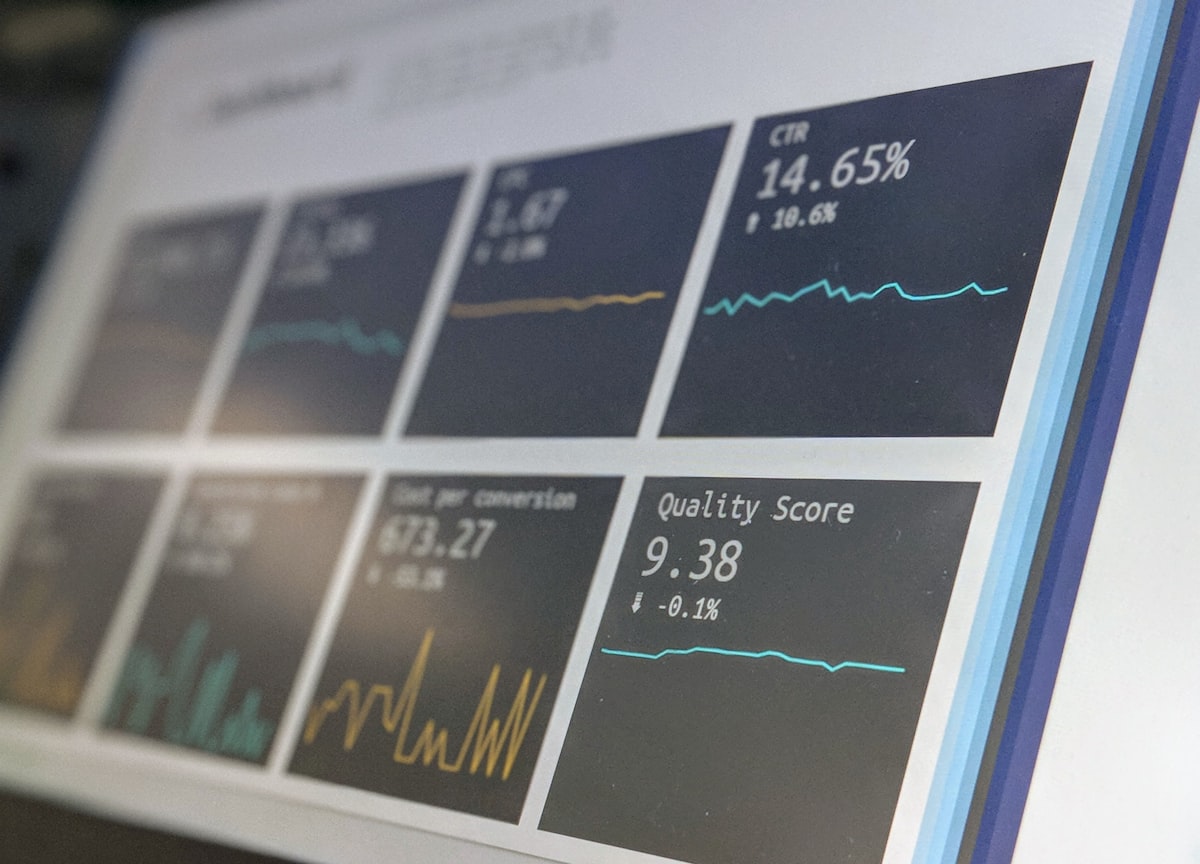
The invoice tripled and nobody could say why. That is the normal state of observability spend — not because it is complicated, but because the levers are invisible until you name them.
Three levers, that is all
Every observability bill is some function of three things:
- Ingest — how many bytes of telemetry you send. Driven by log verbosity, metric cardinality, and trace volume.
- Retention — how long you keep it. The difference between 7 and 90 days is often the difference between a reasonable and an alarming invoice.
- Query — how much you scan. A dashboard that auto-refreshes every five seconds over thirty days of data is a standing cost.
Attribute the spend
You cannot control what you cannot attribute. Tag telemetry with the team that produced it, then bill it back:
usage
| stats bytes = sum(ingest_bytes) by team, signal
| sort bytes desc
Make the trade-offs explicit
Once teams see their own numbers, they make sensible choices without being told to: drop the debug logs nobody reads, shorten retention on high-volume metrics, and sample the traces on the boring paths. Cost control is not austerity — it is visibility.
The curious-query tax
The last lever surprises people. An expensive query is a recurring cost every time it runs. We put query cost estimates in the editor, so a curious analyst sees the price before they hit run. Curiosity is good; unbounded scans are not.