Ship fast. Sleep through the night.
Helix unifies metrics, logs and traces into one on-call workflow — so you find the failing span before your users do.
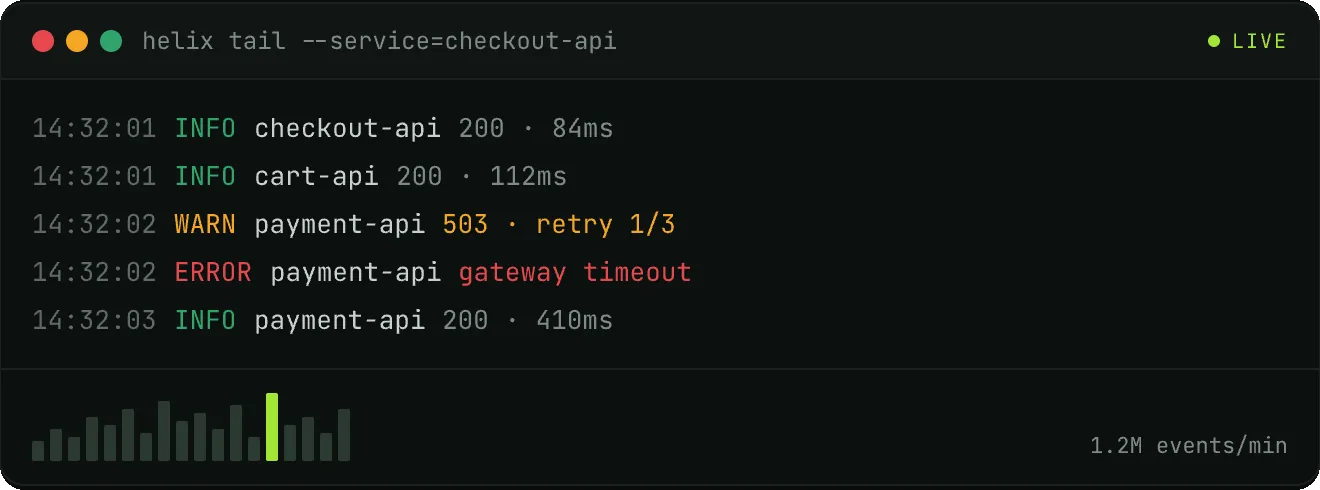
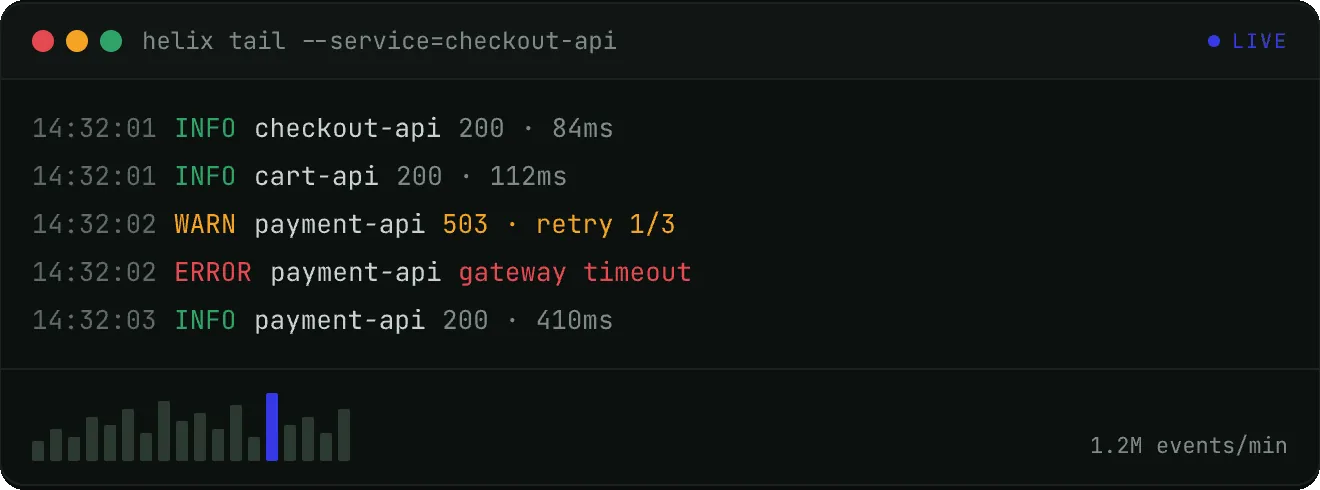
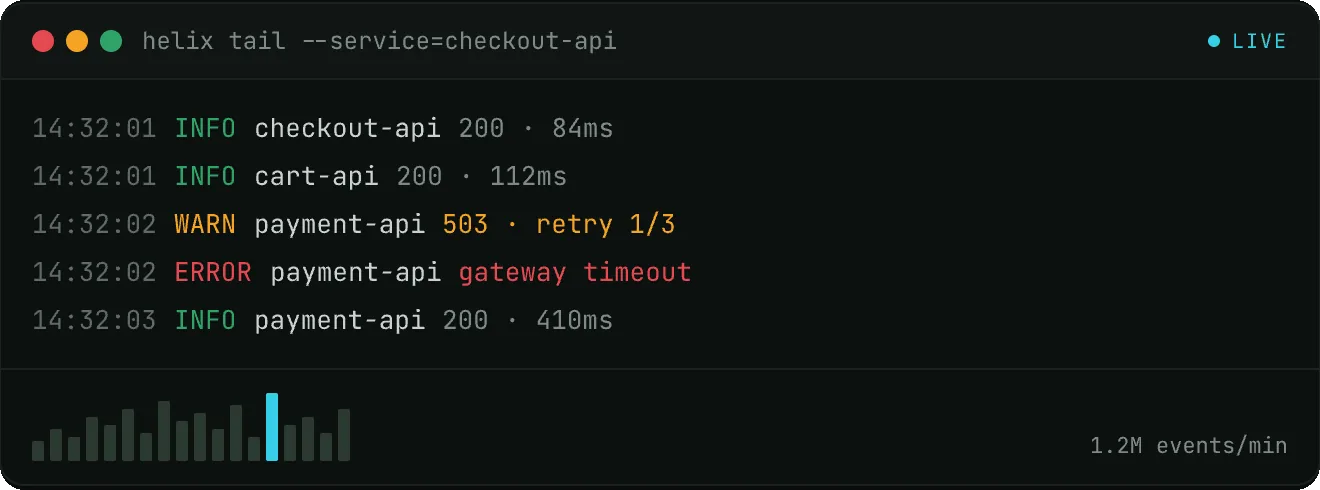
One platform for every signal
Stop stitching together five tools. Helix ingests, correlates and alerts on your entire stack from a single, fast pipeline.
Unified telemetry, one timeline
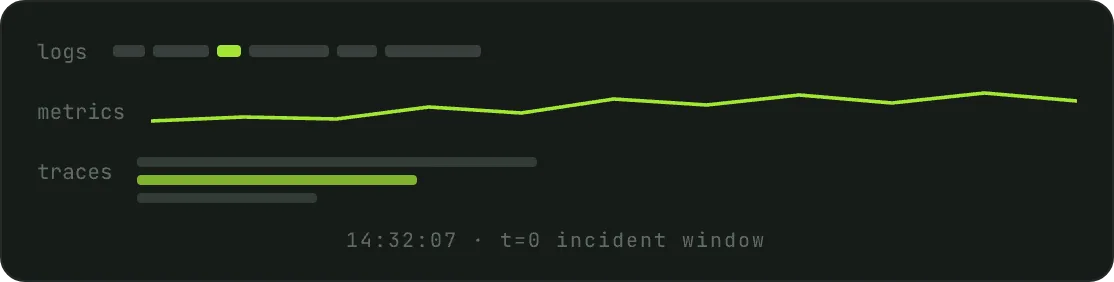
Logs, metrics and traces share one schema and one clock. Line them up on a single timeline and the correlation that used to take four tabs is just there.
p95 query latency scanning 10 billion events. Ask a question, get the answer before you blink.
Smart alerting
Baselines that learn. Page only when it matters.
Distributed tracing
Edge to database, with flame graphs and span context.
Tiered retention
Hot for 30 days, warm for a year. Pay for what you query, not what you hoard.
SOC 2 & SSO
SAML, SCIM, audit logs and field-level redaction from day one, every plan.
From alert to resolved in four moves
Anomaly fires
Helix spots the latency spike before the threshold alert would.
Right team paged
Ownership routing pages the payments squad, not everyone.
Root span found
The trace explorer pins the failing downstream call.
Rolled back
Deploy reverted, incident closed, timeline saved.
Ask your telemetry anything
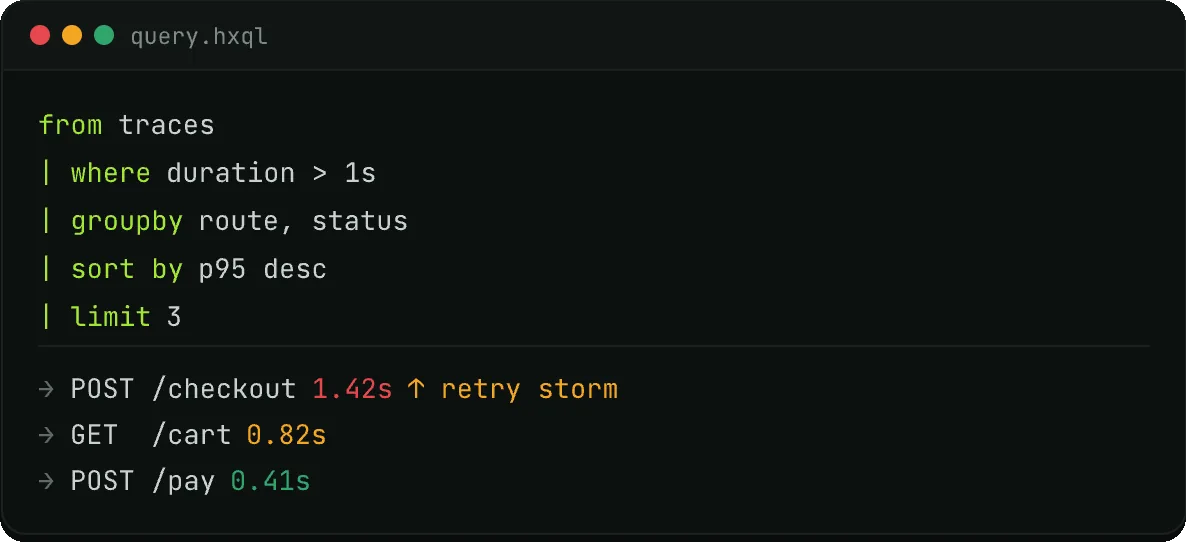
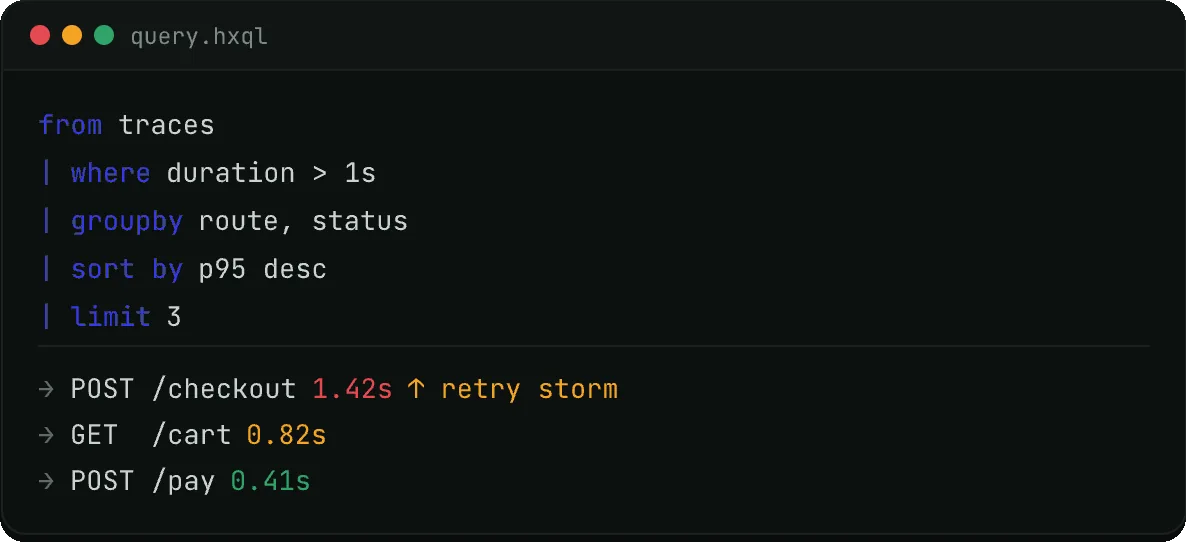
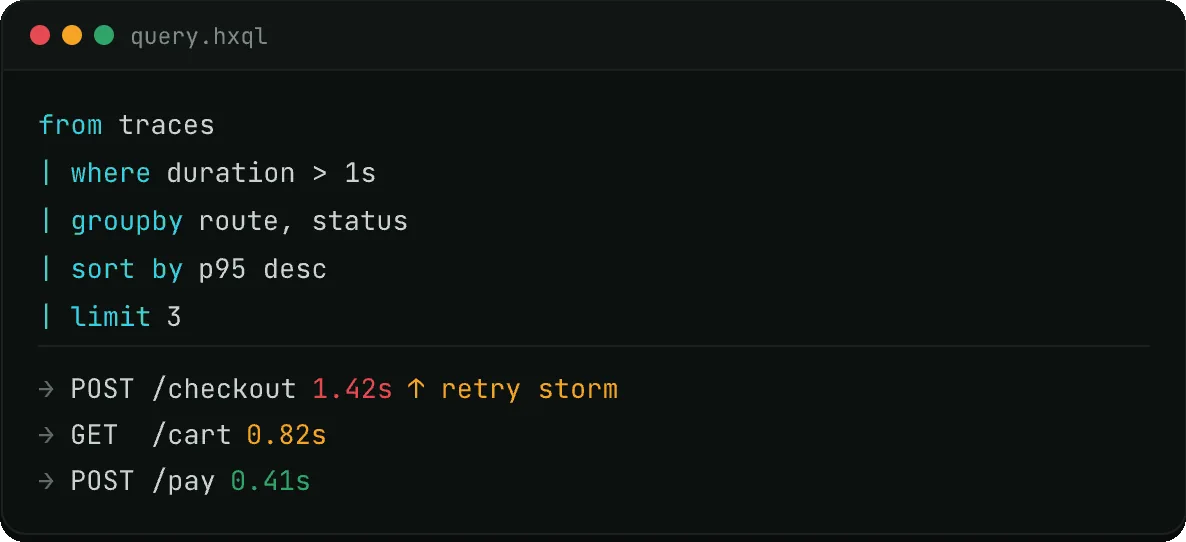
HelixQL turns dashboards into a query language. No more clicking through twelve panels to answer one question.
- Join logs to traces in one expression
- Save and share queries as alerts
- Sub-second over 13 months of data
- Versioned, reviewable, in git
(04) / FROM THE ON-CALL
Loved by engineers who carry the pager
We cut mean-time-to-resolution from 40 minutes to under 6. Helix is the first tab open during an incident.
 Priya Raman Staff SRE, Northwind
"One query language for everything killed three separate dashboards. Onboarding new on-call took an afternoon."
 Marcus Lee Eng Lead, Quanta
"The bill dropped 60% after we moved off our legacy APM, and queries got faster. Rare to get both."
 Sofia Alvarez Platform Eng, Orbital
// get started in minutes
Your next incident is coming. Be ready for it.
Free for 14 days. No credit card. Pipe your first logs in under five minutes.